In my recent work the topic of Realized Profit and Loss in Front Arena has popped up again and again. For derivatives this is relatively easy as there is one trade for every instrument and at most there may be a closing at some point. Securities however may be bought and sold multiple times in different portfolios and calculating the RPL can quickly become a challenging task which involves tracing how the position was built up and then liquidated. Prime comes with robust algorithms to do this matching and supports several different methods for this (Open Average, LIFO, FIFO, etc.). They can be configured in the Accounting Parameters and are applied consistently for all calculated values. However I have observed that there is some confusion about what to expect, when using these methods and thus I decided to write a post about this topic.
The central points that I want to make here is that whatever matching algorithm is chosen, the results that you see in your report also depend on:
- The way trades are divided into portfolios
- The level of calculation (trade sheet or portfolio sheet)
- How you insert your items (selecting portfolios, query folders, trade filters, etc.)
- How you apply groupers
This is not always intuitive, users may expect other behavior, and I have not seen a documentation of this so far, so I decided that it is a good idea to explore this with some simple examples.
The first thing that for RPL the portfolio matters. The matching algorithm will only match trades that are in the same portfolio. An exception to this are compound portfolios and I have set up a structure with two simple portfolio (Portfolio 1 and 2) and a compound portfolio on top (Seuperportfolio1).
In the simplest case I buy and sell the same stock in the same portfolio:
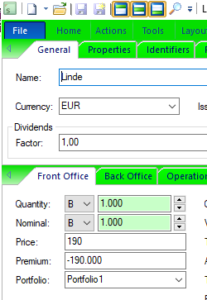
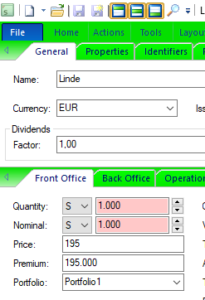
Economically this is straightforward. Buying the stock for 190,000 and selling it for 195,000 leads to a profit of 5,000. This profit is attributed to the sell-trade since this started as a long position and it is the sell-trade that realizes the profit.
We can see this best in Trading Manager in a Trade Sheet:

As you see the 5,000 are the RPL for the sell trade in the simple portfolio and also in the compound portfolio. If the question is “How much did we make with this trade?” which is for example the relevant question for Accounting then this is the relevant view to look at.
The portfolio sheet in this case also shows the same RPL. Here can’t be attributed to a particular trade as the portfolio sheet only shows results on instrument and portfolio level. It can answer the question “How much did we make trading with this instrument in this portfolio?” so it will aggregate the realized profit and loss of multiple trades as long as they are in the same portfolio.
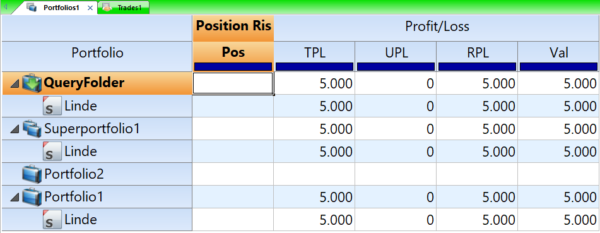
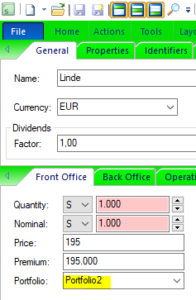
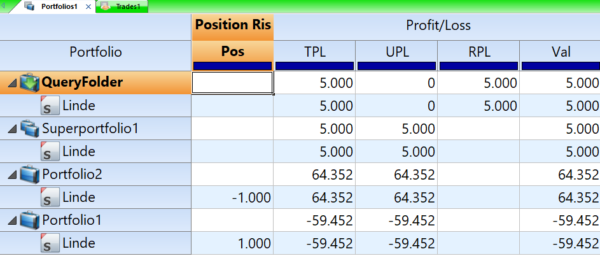
However the results would change if the trade is bought in one portfolio and sold in another. To show this let’s change the sell trade to Portfolio2.
Examining the Trade sheet now shows no RPL in the simple portfolios (Portfolio1 and Portfolio2). The matching algorithm views the sell trade not as a trade realizing a long position but as a trade that starts a short one. On the compound portfolio level however the trades are thrown together in the algorithm so there we do see an RPL. This is for example useful when you want to analyze the PnL at desk and at organization level or when different accounting standards require you to view your position differently (gross or net positions).

However the portfolio sheet doesn’t follow this logic since it shows zero RPL at the compound portfolio level. The attribution of PnL at the simple portfolio level remains even when the results are calculated for the compound portfolio.
Effect of Insert Items
It turns out that the way items are inserted also has an influence on the result calculation. So far we have inserted full portfolios in the portfolio and the trade sheet for the examples here. For the compound portfolio this looks like this:

One other way to insert all the trades of the compound portfolio in the portfolio sheet is by inserting a query folder like this:
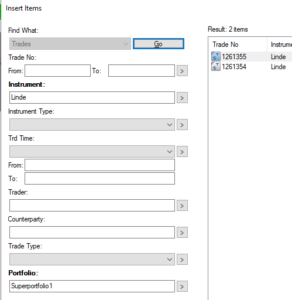
Interestingly this changes the RPL-result and shows that whether the trades are selected with a portfolio or with a query folder matters for the matching algorithm.

This also can be seen in a trade sheet. Here there is no option of inserting portfolios so I have been working with query folders all along, but it still matters what trades are selected by these query folders. If I select both trades in the compound portfolio the RPL is 5,000 but if I only select the sell trade it is zero. Clearly RPL is not simply calculated in one line here but with the whole selection in mind.

Grouping
Groupers are a powerful feature of Trading Manager but for RPL they may lead to unexpected results. Applying groupers separates the trade set and gives only subsets to the matching algorithm. It then has the same effect as putting them in separate portfolios resulting in short positions instead of liquidation.
Here I have put both trades back in Portfolio1 and grouped by counterparty and as you can see for each counterparty RPL becomes zero although it is 5,000 for the whole portfolio. This happens for the trade sheet:

As well as for the portfolio sheet:
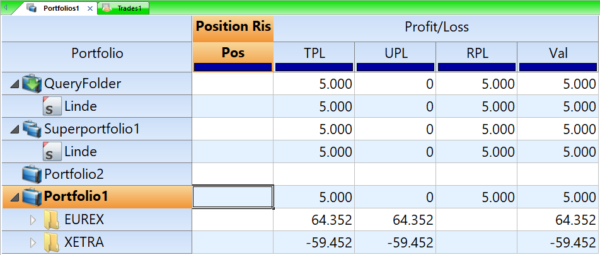
Grouping leads to the matching algorithm looks at the subsets of trades in isolation and the RPL that is present in the portfolio can’t be attributed to a particular subgroup (in this case the counterparty) if the buy and sell trades are separated. Whether this makes sense is a somewhat philosophical discussion. Did I make profit here because I bought low with one counterparty or because I sold high to the other? Technically you can group on anything and it’s not the task of the matching algorithm to decide for one narrative against another. This is a strong argument for keeping it simple even if the results may surprise the user.
Conclusion
As we saw working with RPL and matching algorithms in Trading Manager can be tricky and maybe even counterintuitive. When it comes to designing your report choosing the right view of the data depends on what question you want to answer. There are no universally right and wrong choices but only choices appropriate for a particular setting.
